This site uses cookies to improve your experience. To help us insure we adhere to various privacy regulations, please select your country/region of residence. If you do not select a country, we will assume you are from the United States. Select your Cookie Settings or view our Privacy Policy and Terms of Use.
Cookie Settings
Cookies and similar technologies are used on this website for proper function of the website, for tracking performance analytics and for marketing purposes. We and some of our third-party providers may use cookie data for various purposes. Please review the cookie settings below and choose your preference.
Used for the proper function of the website
Used for monitoring website traffic and interactions
Cookie Settings
Cookies and similar technologies are used on this website for proper function of the website, for tracking performance analytics and for marketing purposes. We and some of our third-party providers may use cookie data for various purposes. Please review the cookie settings below and choose your preference.
Strictly Necessary: Used for the proper function of the website
Performance/Analytics: Used for monitoring website traffic and interactions
The following is a guest blog post brought to you by Elizabeth Engel of Spark Consulting and Peter Houstle of Mariner Management. They have extensive knowledge and experience on what it means to look at big data in order to make association decisions. Both are well known veterans to the association industry. Send via Email.
The report draws on skills proficiency data from its online courses as well as third-party metrics such as the World Bank’s GDP per capita , its Human Capital Index and labor force participation rates to analyze skills and competencies around the world. A ranking of 69 puts us in the “Emerging” category on the global skill ranking scale.
Introduction HR teams today are under increasing pressure to provide data-driven insights that help drive business strategy. However, many organizations struggle to adopt people analytics due to common challenges such as budget constraints, lack of technical expertise , and the complexities of managing data across multiple HR systems.
In addition to ensuring the content will launch and run on each customer’s LMS, eLearning content vendors need to be able to gather learner data, provide customer branding, and, of course, make sure that each customer is following the terms of their license. Better yet, you can track data on your training across multiple customers’ platforms!
In this blog post, we have included 10 of the best tips you can use to create a customer service training program that delivers results. However, there are three categories of delivery methods and topics you should consider, including. However, simply having a training program in place is seldom enough.
He likes to back up his intuition with data to drive continual improvement, tackle new problems with both creativity and practicality. Posts by Andrew Dyer at Workable Blog. Chris Hicken ‘nuffsaid blog. His approach combines neuroscience with dataanalytics and enterprise-wide improvement to deliver dramatic results.
In this blog post, we will share the top 10 tips specifically designed for Moodle Cloud administrators to enhance their LMS implementation and management. Streamline Course Organization: Organize courses in a logical and intuitive manner, utilizing categories, subcategories, and course formats.
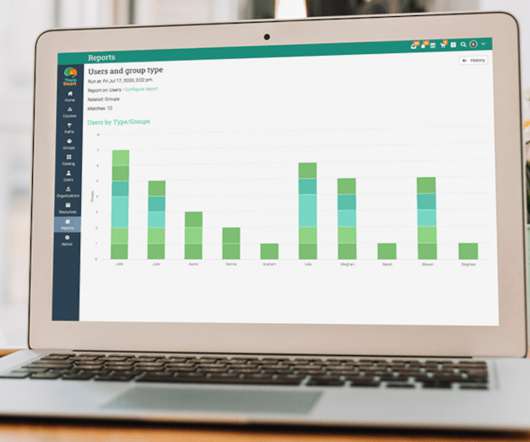
Paradiso LMS provides you pre-made out of the box reports that are distributed between categories. There are drop-down categories in all the reports. There are users type reports, course type reports, system type reports, performance management type reports, as well as all the reports under one category if you prefer.
During the summer of 2018, we conducted a Learning Analytics Research Study to research how our clients are actually implementing these analytics. This research aimed to place organizations on the learning analytics triangle as a measure of maturity, and to paint a picture of what this actually looks like in 2018.*
There is easy integration with dataanalytics including Google Adwords, and Facebook. For example, slide decks, videos, podcasts, blog posts, brochures, infographics, and other animations. These can be useful if you want to group your courses into learning tracks or categories. ” Add A BLOG. Add Gamification.
The designing and functioning of the eLearning authoring tool depends upon the category of tool being used. There are two main categories classified as Desktop and Cloud based eLearning authoring tools. It ensures that your data is secure and you won’t lose any vital documents if the computer crashes.
The highest complexity of learning analytics is predictive and prescriptive analytics. This means using data to either predict what might happen, or to prescribe learning activities. Prescribing Potential Prescriptive Analytics. Recommended Reading: Learning Analytics & Complexity. Minding the Gap.
Summary This blog explores AI training strategies for workforce readiness, emphasizing continuous learning and personalized development to ensure tech-savvy, motivated employees as AI transforms future roles. Access to real-time insights and analytics also helps in the learning and development of such skills.
Learning Analytics seem like a bit of a dark art, a mystery. It’s this question that inspired us to conduct our Learning Analytics Research Study so we could better understand how our clients are implementing these analytics in practice. Corporate Learning Analytics in Practice [Introduction]. Data Evaluation Complexity.
In this blog, we dive into the general interest in AI in learning and development, paying particular attention to how it can be utilized by training providers. From these five responses, the three answers that collected a larger share of the vote than last year were: AI Personalization and adaptive delivery Learning analytics.
This blog post will explore the top 10 ELMS for 2023, highlighting their features, pros and cons, pricing information, and user reviews. for ease of setup in the core HR category, which compares well to the average ratings of 8.6, User Interface and Ease of Use: Intuitiveness, navigation, and overall user experience of each platform.
However, in this article, we’ll try to sort out the relevant categories and what to look for. The tools that every L&D professional needs fall into three categories: 1. There are many options in this category but it’s important to find one that aligns not only with what the designer needs but also with what learners need.
A learning management system (LMS) provides rich analytics and reports that help trainers better understand what’s happening with learners and how they’re progressing through courses. While there is no doubt that an LMS offers insightful analytics, there is no need to know or use them all. Progress analytics.
We’ve introduced our Learning Analytics Research Study and explained how learning categories are split into dimensions. And now it’s time to explore results from our study, starting with an overview of these categories, including two new categories we discovered. What are the categories of learning analytics?
Moodle learning analytics can be presented in three different report formats. In this blog, we’ll look at the importance or usefulness of Moodle SQL reports and how to get them from a Moodle analytics tool, LearnerScript. When the default Moodle reports can’t meet your analytics needs, you go for the Moodle SQL reports.
In this blog post, we’ll explain different types of learning tools and how you can benefit from each one. So, you’ll likely need to double check that the tools you select enable elegant delivery and useful data for analytics. Content & Learning Analytics. 7) Learning Analytics Platform (LAP). Content Creation.
This blog post will explore the top 10 ELMS for 2023, highlighting their features, pros and cons, pricing information, and user reviews. for ease of setup in the core HR category, which compares well to the average ratings of 8.6, User Interface and Ease of Use: Intuitiveness, navigation, and overall user experience of each platform.
This blog post will explore the top 10 ELMS for 2023, highlighting their features, pros and cons, pricing information, and user reviews. for ease of setup in the core HR category, which compares well to the average ratings of 8.6, User Interface and Ease of Use: Intuitiveness, navigation, and overall user experience of each platform.
Over the past 20 years, Andy’s provided guidance to over a thousand businesses, written hundreds of articles on content strategy, SEO and Analytics, and authored the book Content Chemistry: The Illustrated Handbook for Content Marketing. [ So video has that huge advantage over blogs and podcasts in terms of connection.”. Orbit Media.
eLearning Technology Tony Karrers eLearning Blog on e-Learning Trends eLearning 2.0 Content usage patterns - preferred ways to consume various content topics, busiest days and times for viewing content, amount of time spent viewing content and participating in discussion threads and blogs, and preferred way to “find” content.
As I wrote “ Time to Build Your Big Data Muscles ” for Fast Company, I discovered more fascinating bits of data about big data than I could include in the article. If all these numbers make you wish for a reference guide, James Huggins answers How Much Data Is That? Data specific to the job market.
This blog explores how technology-driven learning enhances critical thinking, problem-solving, and digital literacypreparing students for tomorrows job market. In this blog, we will explore different methods of learning, the role of K12 EdTech and its pros and cons, and whether digital learning platforms are beneficial for students.
Organise content in other ways, instead of by ‘top-level category’. All that this really entails is thinking in a more pragmatic and ‘semantic’ way about categories for content. Top level categories like ‘ERP’, ‘SharePoint’ and so on aren’t as helpful as a larger number of more focussed and contextualised categories.
By Kais Zribi, General Manager, Middle East and Africa at Coursera Confidence, a Nigerian data analyst and biologist, discovered the power of online learning during the pandemic. With a degree in Biological Sciences, she sought to enhance her skills through online courses, including a Google DataAnalytics professional certificate.
In the last post of our case study blog series , Alfonso Riley, learning technology consultant at Caterpillar Inc., As a result of architecting a robust learning ecosystem , Caterpillar’s Global Dealer Learning (GDL) achieved streamlined metrics through the learning ecosystem and provided on-time dataanalytics.
Deployed on an annual basis, these surveys did have some success in gathering relevant data and giving HR specialists pertinent ideas about what was working and what needed to be improved. The annual employee satisfaction survey with its numerous questions broken down into categories is obsolete by now.
If I see them in the above-average category and considering them for say a client, then they complete an extensive document, and from that, in combination with the “viewing of the system”, it will place them into a final slice of where they end up in consideration. What about data visualization? Can I see the data points?
The server component facilitates the creation, delivery, and management of training courses, stores data in a dedicated database to which it provides controlled access, maintains a registry of authenticated users, sends notifications, and so on. Data Security This is one of the most important features that you must consider.
The server component facilitates the creation, delivery, and management of training courses, stores data in a dedicated database to which it provides controlled access, maintains a registry of authenticated users, sends notifications, and so on. Data Security This is one of the most important features that you must consider.
The server component facilitates the creation, delivery, and management of training courses, stores data in a dedicated database to which it provides controlled access, maintains a registry of authenticated users, sends notifications, and so on. Data Security This is one of the most important features that you must consider.
There is an urgent need to seek effective ways to collect data about learner performance and utilize it to enhance eLearning experiences for both educators and learners. This data will not only improve eLearning experiences, but also serve as a good reference point for organizations when making critical decisions. An eLearning course.
In our last blog post, we introduced our latest series that focuses on findings from our Learning Analytics Research Study—during which we collected and analyzed data to see how real organizations are implementing learning analytics. Beware of seasonal data patterns. views per report.
Also, customers better know the average performance of similar brands in the product category, which helps to increase their loyalty and trust in you. Plus, you can create multiple classes or groups with assignment scoring and track data using only one tool. 7 Market leader positioning. Choose your learning method. Upload your course.
This blog will explore how businesses can use AI-powered staffing solutions to keep up with the fast-changing job market. The first thing you need to know about AI recruiting software uses an algorithm based on logic and data points to make decisions about hiring decisions for companies as virtual assistants.
However, large corporations and businesses experiencing rapid growth may struggle to maintain real-time headcount data. Understanding Headcount Data: Metrics That Matter Avoiding the problems an unclear headcount can bring involves paying attention to the right data. What Is Headcount Monitoring?
In this case study blog series, guest contributor Alfonso Riley, learning technology consultant, will explore how he and his team at Caterpillar, Inc. built their learning data ecosystem to support an award-winning extended enterprise learning model. In this series, we’ll cover Caterpillar’s: Business & Data Challenge.
In particular, it provides a highly instructive example of the ways that learning analytics using xAPI can help an organization meet defined performance goals and objectives. . From a learning analytics point of view there were two fortuitous aspects of this project that make it a great case study to look at: .
We also analyze data on user behavior and usage patterns to identify any areas that could be improved. We take all feedback seriously, whether it's a small suggestion or a major pain point. Identifying Industry Trends and Innovations Staying up-to-date with the latest trends and innovations in the eLearning industry.
In 2015, we believe experimentation with analytics-driven performance improvement will lead to more “intelligent recommendations” and personalized professional development in Continuing Medical Education and beyond. Data can be used to recommend related PD content (e.g., It’s an area with fascinating growth potential.
We organize all of the trending information in your field so you don't have to. Join 59,000+ users and stay up to date on the latest articles your peers are reading.
You know about us, now we want to get to know you!
Let's personalize your content
Let's get even more personalized
We recognize your account from another site in our network, please click 'Send Email' below to continue with verifying your account and setting a password.


Let's personalize your content