This site uses cookies to improve your experience. To help us insure we adhere to various privacy regulations, please select your country/region of residence. If you do not select a country, we will assume you are from the United States. Select your Cookie Settings or view our Privacy Policy and Terms of Use.
Cookie Settings
Cookies and similar technologies are used on this website for proper function of the website, for tracking performance analytics and for marketing purposes. We and some of our third-party providers may use cookie data for various purposes. Please review the cookie settings below and choose your preference.
Used for the proper function of the website
Used for monitoring website traffic and interactions
Cookie Settings
Cookies and similar technologies are used on this website for proper function of the website, for tracking performance analytics and for marketing purposes. We and some of our third-party providers may use cookie data for various purposes. Please review the cookie settings below and choose your preference.
Strictly Necessary: Used for the proper function of the website
Performance/Analytics: Used for monitoring website traffic and interactions
In more recent years, websites, wikis and blogs have entered the picture, creating social learning platforms that learners can modify themselves. Download the whitepaper » Blog this! Search the blog Popular Latest Comments Tags Web-Based, Instructor-Led, EPSS? That’s where “party boxes&# might come in.
Connie, known online as the “eLearning Coach,” is the author of Visual Design Solutions , a top rated eLearning design book. She has also been consulting independently for nearly two decades, with a focus on online learning, visual and information strategies and design. You can read more about Clive on his blog. Allen Partridge.
Check our insightful blog: A Mini Guide on Flash to HTML5 Conversions. Unlike Adobe Flash, you don’t get HD videos and rich visuals. They can also use tags to create these, without external plugins. As HTML5 is mostly used for web-based mobile applications, data security and privacy concerns are high.
ALT text can be read by screen readers, making visual content more accessible. Refers to collections of data that are too large or complex to be processed using traditional applications. Big data can reveal patterns, trends, and associations in learners and performance. Data Visualisation. Short for application.
Often the real meaning and potential impact of a database can be hidden behind all the raw names and numbers, but a well-chosen visualization can bring the data to life. Google fusion is a cloud based application from Google where you can share and visualizedata online. You can export your data as csv too.
The machinimatographer records sound and visuals, then compiles the story strategically for learning results. She also mentioned in her blog she doesn't like the Wikipedia definition of Machinima.) Here is another interesting machinima illustrating the concept of "data". Visualization of Data from Ariella Furman on Vimeo.
The data backs this up. For instance, you might want to write a blog post about “5 Tips for Finding a Speculative Fiction Writing Group,” or “How to Give Constructive Feedback in Your Writing Group.” You should always header tags to format your posts for greater readability. Some readers will probably already know a few things.
Blog has examples of resources, datavisualization, favorite tools (most free, some paid). Visual test with maps–created in WebCT, can be done elsewhere too. Zip files for Blackboard course available on blog. Technorati Tags: interactivity , multimedia , usability , navigation , coursedesign , tcc08.
This blog post intends to summarize both parts in separate posts. Types of application: Based on application style(visual and behavioral). Immersive applications: Offers a visually rich environment to user. See and Point: Using list form to get user input instead of asking user to input data in text area.
brainstorming: lots of wikis, blogs, social networking, audio/podcasts. Visualization: Tools make it easier to understand information and relationships between concepts. Look at financial tools like Mint or Wesabe that make it easy to visualize your spending trends. Meaningful assessment & use of data. Tagging tools.
It’s difficult to offer a comprehensive discussion of all relevant inputs and considerations in blog post form, but I want to start a discussion and present a few tips that may help educational directors and technology directors get (and stay) o n the same page—especially when it comes to the Learning Management System (LMS).
As per World Health Organization data, there are over 1 billion people, which accounts for 15% of the global population, who suffer from disabilities. This blog is all about this, and more! Imagine a visually impaired student who requires course materials in a format compatible with a screen reader.
In the art world, prompt-driven AI tools like Midjourney can create stunning visuals on demand. In L&D specifically, automation via AI might look like: Auto-tagging. Making things easy to find is no small feat when dealing with data and content. Classifying 12 pieces of content is no problem for a human. Search indexing.
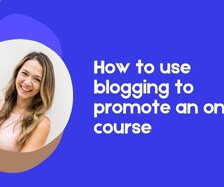
A blog is one of the easiest and most cost-effective ways to promote your course online. Blogging to promote an online course is a powerful tool for driving organic traffic and boosting enrollment for your online course. This blog will discuss how creating a blog to market your course can help you achieve the desired outcomes.
Datavisualization sites. Visually shows differences in people’s opinions. And we distracted her with questions and she never got back to the second island… Cynthia’s blog: [link]. Tags: Games & Simulations Higher Ed e-Learning Cynthia Calongne Second Life TCC09. e.g. tour the space shuttle.
My live blogged notes…ASTD TechKnowledge 2010 in Las Vegas, NV. didn’t ask about quality, efficiency, satisfaction) Step 2: Defined the options They constructed 26 snapshots (options derived from literature, conferences, blogs, etc.) – e.g., “Our programs are delivered in a virtual classroom. The big names talk about how web 2.0
Here are two posts of related resources from my blog. The game is actually a hybrid of a board game and some computerized data manipulation to help managers understand succession planning. One such person was Amanda Myton, took awesome and great visual notes which can be accessed here. ASTD ICE Slides. Lesson Learned.
Sometimes its not even consciously done -- they might put up photos and tag them -- dont mean to generate content for others, but they do) Wearable computing (being a cyborg and having implants is the stuff of sci fi -- but its not that far away) "We look at the future through rear-view mirrors." This was an example of a mashup.
For instance, Mark Oehlert (@moehlert) was inspired to write “ Harold Jarche is Wicked Smart and We Need to Talk about Curriculum “ I know Harold, and he is wicked smart (see this skewering of homework), so I commented on his blog and it seems we may have a semantics difference as opposed to a fundamental one.
Before discussing how to make your Lectora course more accessible/ 508 compliant , it’s important to keep in mind two main principles to make your course accessible: Provide an equivalent experience for those with hearing, visual, motor function and cognitive impairments. The data contained in a table will not make sense without this.
The #2 killer of performance support is old data. so you can tag the appropriate content to the appropriate processes) What gets taught in levels 1 and 2 (the training) “Live in the moment of consumption and performance , not knowing and being aware.” . ** Training groups haven’t changed to support the design of performance support.
These are my live blogged notes from the International Conference on eLearning in the Workplace (ICELW) , happing this week in NYC. Learners create their own content map through tools, sharing, collab, tagging, voting, networking, user generated content. Big Data – give us the picture of the big learner network. The Web Web 2.0
Google Reader Its how I stay informed on the latest blog posts and news. My blog is part of my external brain. So easy to clip from articles online, jot down to do lists, and tag and organize it all. Delicious Tag articles as you go. Fire up your blog! Now I stop first at Twitter. Evernote I heart Evernote.
So video has that huge advantage over blogs and podcasts in terms of connection.”. Web design is all about a visual hierarchy. Images are more visually prominent than text, and videos are more visually prominent than text or images. Once the trigger is fired, the tag is recorded. Video is accessible and compelling.
Now I see that you can publish a Google Doc right to my blog, so Im going to try that now. Not sure if it gives me any advantages over writing a blog entry in Blogger. Nor can you add tags when publishing to your blog. Blog Book Tour: Learning in 3D #lrn3d Allison Rossett: ELearning Isn’t What You Think It.
Strong visual aesthetic. Lots of widgets on the site View other users who are logged in and talk to them Watch videos of CEO, corporate commercials If logged in behind Sun Firewall, see Tag Cloud and more links to internal information. Blog Book Tour: Learning in 3D #lrn3d Allison Rossett: ELearning Isn’t What You Think It.
Visualizations: See your workload at a glance with kanban boards, Gantt charts, or priority lists. Automation: Reduce repetitive tasks: Automate data entry, scheduling, and reminder notifications. Bonus points: Security and privacy: Ensure your data is protected with robust security features.
Wednesday, September 19, 2007 My Online Visual Identity When Michele Martin changed her profile picture the other day, I realized I was a bit disoriented. Ive had the same profile picture up for months -- on my blog, in Facebook, MyBlogLog, and now here. The power of the personal; building a friendlier world through blogs.
Synthesis: Scientific data is usually presented as raw boring information. Learn how to use scientific data in story telling like ‘The Tech and Science Behind Little Red Riding Hood’ featured in the American Scientific. __ Watch the video ‘The Tech and Science Behind Little Red Riding Hood’.
To assist you with this, in this blog post we cover twelve actionable SEO tips. Tell tale signs of an out of date design are outdated visuals or a poor user interface. You can learn more best practices for optimizing website speed in this handy blog post from Cloudflare. The <h1> heading also includes the target keyword.
Learn through Visual Search Engines. It’s a visual search engine that draws content from all over the Web, particularly social media sites. Your collage might show a book from Amazon, a YouTube video and a page from a blog or web site. Other visual search tools include: viewzi , Kart00 and search-cube.
Don’t write a website, page, or blog post just for Google’s machines; write it to provide the best possible value for your readers, and you will succeed in attracting the right audience. Answer the Public: Visualize your subject and find questions relevant to your topic. Blogging for SEO. But, first, a word of advice.
A good curation tool will help you categorize, tag, and annotate information. Verify Information: To ensure accuracy, cross-reference facts and data with multiple sources. The tagging feature allows you to categorize your saved content, making it easy to find exactly what you need later. Workplace Example: Use Scoop.it
I tagged some of the resources I found on deli.ci.ous, which youre free to grab yourself. 9:38 PM Post a Comment Newer Post Older Post Home Subscribe to: Post Comments (Atom) Cammy Bean Greater Boston, MA, United States View my complete profile About This Blog Subscribe in a reader Subscribe via email Are you an Instructional Designer?
The key from an integration standpoint is the ability separate audio files and tag them. using Mp3 tagging - ID3) 5:54 PM MBritz said. Slides without audio had a slash through the speaker icon -- as typically seen with a mute visual indicator. The slide/screen itself can focus on key points and or use diagrams. Take the Survey!
Course authoring should let associations include videos and images within courses for visual interest, games for additional learning strategies, as well as interactive drag-and-drop experiences for variety. Remember: analysis leads to data-driven decisions, which leads to a stronger education program in the long run.
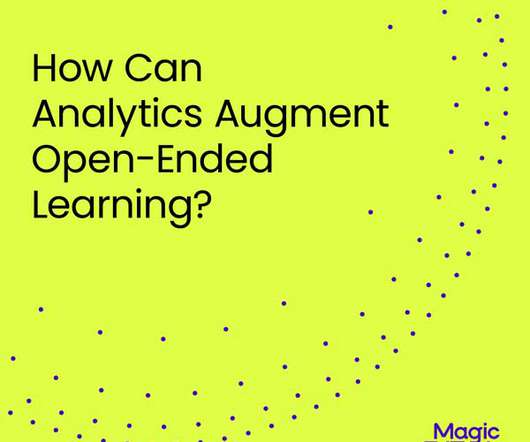
The nature of the data produced by these interactions is quite unique. It needs to be displayed via an effective dashboard design that shows data sources, analysis, and visualizations for these open-ended and exploratory environments. What can we achieve through learning data?
10 Free Audio Programs to Use for E-Learning - Rapid eLearning Blog , June 1, 2010 I’m no audio engineer. Time Saver Tuesday - 10 Tips - Before You Record - Visual Lounge , June 15, 2010 Anyone can make a screencast, right? At one point he stopped and seemed to read a bit. We all do it. And odds are that neither are you. Epistemology.
Points of control = Rents - Lockergnome Blog Network , October 29, 2010. The Data Bubble II - Doc Searls Weblog , October 30, 2010. The SMAQ stack for big data - OReilly Radar , September 22, 2010. How Facebook and Twitter Are Replacing Blogging - Forbes.com: News , November 4, 2010. Can experience be designed?”
Summary This blog discusses the importance of alt text, introduces EqualSense as an AI-powered generator, and explains its machine-learning approach to creating contextually relevant descriptions. What happens if they are one of the hundreds of people who use screen readers and are visually impaired?
With so many form factors from smartphones to oversize touch screen computers – and now the iPad, revolution/revelation how we handle data, text and imagery, plus coherent manipulation of screen objects is becoming of paramount performance. The same movement must be energized on the visual and interactive design side, too.
From tags, keywords, and links to site structure, design, and visitor behavior, SEO optimizes these elements to get the attention of search engines. A title tag is an HTML code tag. Optimizing title tags also allows pages to be easily linked and ranked. How does SEO work? What does it mean? So it pays to get it right.
I have seen and taught with a tool called ProtoSphere that has a 3D virtual environment interface but also includes blogs and wikis, an interface with MS SharePoint, the ability to locate experts within an organization, application sharing and the ability to launch e-learning courses. Tags: DESIGN ISD RECENT ARTICLES.
Yes, skill gap analysis existed, from 1999 in fact, after all that was the main premise for an LMS, to identify skill gaps, but the metrics specifically around skill gaps tied to other variables in the system, in a datavisualization standpoint that doesn’t look like a bar chart? to the courses/content. Six months or a year?
We organize all of the trending information in your field so you don't have to. Join 59,000+ users and stay up to date on the latest articles your peers are reading.
You know about us, now we want to get to know you!
Let's personalize your content
Let's get even more personalized
We recognize your account from another site in our network, please click 'Send Email' below to continue with verifying your account and setting a password.


Let's personalize your content