This site uses cookies to improve your experience. To help us insure we adhere to various privacy regulations, please select your country/region of residence. If you do not select a country, we will assume you are from the United States. Select your Cookie Settings or view our Privacy Policy and Terms of Use.
Cookie Settings
Cookies and similar technologies are used on this website for proper function of the website, for tracking performance analytics and for marketing purposes. We and some of our third-party providers may use cookie data for various purposes. Please review the cookie settings below and choose your preference.
Used for the proper function of the website
Used for monitoring website traffic and interactions
Cookie Settings
Cookies and similar technologies are used on this website for proper function of the website, for tracking performance analytics and for marketing purposes. We and some of our third-party providers may use cookie data for various purposes. Please review the cookie settings below and choose your preference.
Strictly Necessary: Used for the proper function of the website
Performance/Analytics: Used for monitoring website traffic and interactions
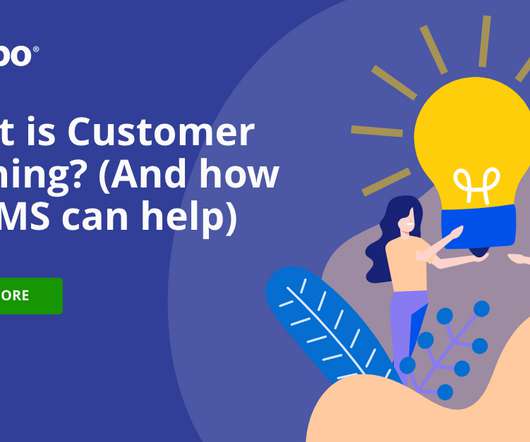
HR Analytics 101: No Data Scientist Required Many organizations find themselves at a crossroads, knowing they need analytics to strengthen their human resource strategy yet lacking the technical skills or budget to hire a full-time data scientist. Pin down one or two pressing business questions that you want to answer with data.
While Coursera and others offer MOOCs covering business and management topics that are relevant across the enterprise, it’s important to realise that other topics (such as statistics, law and IT) may also be relevant to particular teams. Networking. Participating in a MOOC forms connections with people outside of your organisation.
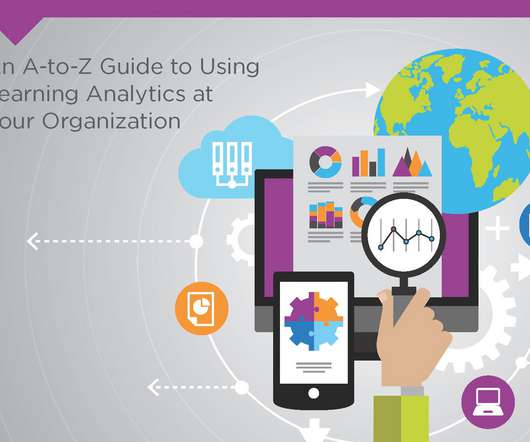
Download The Essential Guide to Learning Analytics in the Age of Big Data and keep it as your eLearning secret weapon! This article is designed to be your A-to-Z guide to learning analytics. Use this as a valuable resource to successfully initiate a learning analytics approach within your company. Introduction.
Learning Data for Analytics and Action (Megan Torrance, Torrance Learning) Data and analytics – it’s a mashup of two things - like chocolate and peanut butter - they go better together! Math & statistics Diagnostic - why did this happen? Statistics Predictive - what will happen? xAPI is the plumbing.
It depends on what fascinating reports you want to have from your Moodle learning analytics. Have it for Quizzes, Forums, SCORMS, or whatever. . . #2. Or it will take some more to adopt this technology into Moodle analytics arena. . One is BigBlueButton Summary and the other BigBlueButton Statistics. Not at all.
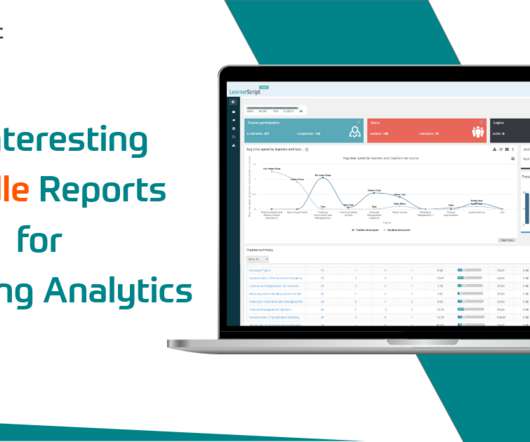
To prove the efficiency of the learning and development (L&D) strategy, you need analytics. In this blog, we’ll get acquaintance with, if you’re not familiar with them, some key aspects in Moodle analytics. #1. Get such a report from LearnerScript, a Moodle analytics tool. #2. Forum Engagement. Competency .
Despite knowing about these statistics, many organizations spend their training time, effort, and budget in inverse proportion! Here is a video below from Charles Jennings (Director of the 70:20:10 Forum and one of the world’s leading thinkers and practitioners in learning and development) on the 70:20:10 learning guideline: [link].
In fact, the World Economic Forum’s “ The Future of Jobs Report 2018 ” found that today’s employees will require significant reskilling and upskilling in just three years. ” As every industry innovates and your company evolves, employees will require the right training to keep up.
The BSc(Hons) in Data Science is designed to equip learners worldwide with the technical, analytical and mathematical skills needed to succeed in todays data-driven economy. The University of Huddersfield today announced the launch of its first fully online undergraduate degree on Coursera.
These factors have largely been responsible for propelling the growth of the analytics field like never before. Analytics are used to process and interpret data in a way that eases everyday lives. The emergence of Learning Analytics. How can Learning Analytics help?
Create open forums where they can ask questions. Analyze your web traffic, product usage statistics, and internal search queries to see what types of information people search for. . Ongoing support might be best suited to a forum or knowledge base. Poll them about what information and training they would find helpful.
Before I explore some of the fundamental customer education statistics and trends, let’s see why this matters in the first place. The platform’s ease of use and robust analytics capabilities allowed Codefresh to create 9 courses and integrate seamlessly with existing tools efficiently.
This may be done on the course forum or on another social media site, which will ultimately lead to more people being aware of the course and, as a result, your course will eventually reach an even larger audience than before. Of course, numbers and statistics should be used for analysis, but they do not reveal the whole picture.
He established and managed the Professional Services, Customer Success, and Customer Data Analytics teams at Profitect (currently Zebra Prescriptive Analytics, after being acquired by Zebra Technologies). His approach combines neuroscience with data analytics and enterprise-wide improvement to deliver dramatic results.
Also, it is simple to use and is loaded with advanced tools for social media integrations, reporting and analytics. It allows you to enrich your courses with discussion boards or forums to get more impact and participation. It has native apps for Android and iOS.
link] December 5-7, 2012 Office of Women in Higher Education National Leadership Forum, 80 th , sponsored by the American Council on Education (ACE), Washington, DC, USA. link] January 10-11, 2013 World Universities Forum, 6th, Robson Square, University of British Columbia, Vancouver, British Columbia, Canada.
Real-time analytics, high-quality video conferencing, and collaborative features let you deliver training that feels fresh, interactive, and personal. Additionally, real-time analytics dashboards offer deeper insights into how each participant is performing. Todays technology provides an exciting answer.
The Be-all and End-all Guide to Creating a Supreme LearnDash LMS
SEPTEMBER 17, 2020
Interactive notifications and forums. Another addition is an interactive forum for all the courses/modules that allow discussions about the same. Discussion Forums. The dashboard gives out all course-specific analytics, even details about pending actions. Course Analytics. Marketing Analytics. Scheduling.
With a single login, learners can access their courses, virtual labs , discussion forums, and other educational resources effortlessly. Consistent data also enhances the reliability of user analytics, which can be crucial for assessing learner progress and platform usage.
In this example, the xAPI-enabled RISC Virtual Training Assistant Forum (VTA) passes data on all kinds of interactions, providing live information on popular topics and active users across the forum, making it easy to see who is most engaged and which topics are getting a lot of attention—all in real time.
Despite knowing about these statistics, many organizations spend their training time, effort, and budget in inverse proportion! Here is a video below from Charles Jennings (Director of the 70:20:10 Forum and one of the world’s leading thinkers and practitioners in learning and development) on the 70:20:10 learning guideline: [link].
Recommended read: this post digs deep into some statistics and facts to further convince of why eLearning developers should embrace visuals when creating their courses. After all, while the conscious mind is analytical and rational, the unconscious mind follows no logic. N: Novelty. S: Social Brain. E: Elicit Emotions.
The company created Dremio University, which provides free online courses not just for Dremio users, but for the data analytics industry in general. For example, they created courses for data scientists to learn more about SQL and statistics courses for database developers.
and configure any other supporting elements such as a student forum or student dashboard page. You’re also going to need to build a website, configure that website with course content, set up a way to charge for your course, create a sales page and other supporting pages such as a contact page, FAQ page, etc.,
Besides, online forums and communities also provide employees a platform to debate, share, and seek information, all of which makes the subject under discussion more relevant and interesting. These tools make interactions between the instructor and employees more effective.
That’s one of many findings in the World Economic Forum ’s 2023 Future of Jobs Report. To help, we identified some top rated programs on Coursera that map back to the World Economic Forum’s top 10 skills of 2023. Did you know? Between now and 2027, 60% of workers will need retraining due to global transformation and macrotrends.
The Be-all and End-all Guide to Creating a Supreme LearnDash LMS
JUNE 6, 2022
When you’re working with a small number of students, responding to queries, sending introductory emails to new learners, and maintaining a discussion forum may not seem like too much effort. Here are a couple of ideas that might help with getting your learners to contribute: Start a discussion forum for your online course.
It offers reporting and analytics. If you are a free user, you can seek help in the community forums. In the meantime, you can visit the support forums on their site to get your answers. You can also get help from the WordPress forums or watch the front-end demo once you create an account. .” – Martin B. LMS with 4.6
We developed our list of high-income skills by combing several job skills studies (from organizations including the World Economic Forum , Pearson , Future Learn , Coursera , and others) and identifying the skills that came up most frequently. This week, we’re going to talk about data analysis skills. That’s all for this week.
Many training websites also provide advanced features like a course library, and authoring, analytics, and engagement tools that can help you create effective training programs for your employees. . It also provides an advanced analytics suite that allows you to track the learning progress of your employees as individuals or as groups. .
To track your team’s progress, you can use EdApp’s reports and analytics dashboard tools , which provide a detailed analysis of your learners’ completed data. Actionable reports & analytics dashboard. Coorpacademy also includes an analytic dashboard, so you’re always updated with your learners’ progress. .
Collaborative projects, discussion forums, or peer review activities are necessary for students to interact with each other and the course content in different ways. Course analytics : Analyzing the data from an LMS can show completion rates, drop-off points and which course components the students get stuck with. Discussion forums.
According to statistics, a top-notch and state-of-the-art LMS may eliminate inefficiencies, consolidate workplace procedures, and, more notably, improve efficiency by 20 to 25%. You can customize your training material, flow, and assessments to increase participant engagement by using a solid analytics framework.
Facilitate s Collaboration: Blended learning provides learners the opportunity to collaborate both in the classroom and on online forums and communities. Besides, several online learning platforms also provide reporting capabilities that automatically generate statistics and analytics. Conclusion.
Additionally, 84 percent of respondents view “people analytics 1 ” as important or very important, making it the second-highest-ranked trend in terms of importance. Data-driven learning, which is a component of people analytics, is an approach that considers multiple factors to determine a person’s learning requirements.
This statistic underlines the growing recognition of immersive learning’s potential impact on education. According to Statista , the Metaverse Education market will grow at a compound annual growth rate (CAGR) of 43.76% between 2023 and 2030, resulting in a projected market volume of 24.7 billion US dollars by 2030.
When using an LMS (Learning Management System) to deliver online training, it’s important to utilise engagement, activity and performance analytics dashboards. Using analytics allows for evaluating learning processes and outcomes, helping to identify skills gaps and optimise future training programs to address them.
The industry accepted statistic that social learning evangelists often refer to is that that formal structured learning (FSL) accounts for only 20% of an individual’s learning. UGC (user generated content) should therefore be seen as a valuable aspect for formal learning context – as much as expert generated content. ” This is true.
Here are some statistics to look at: A Brandon Hall Group study on upskilling and reskilling employees shows 54% of employees feel that learning has weak positive outcomes as they don’t get opportunities to practice/apply knowledge. Even with so much spent on eLearning, a report by World Economic Forum says 50% of all employees in the U.S.
insights from ,, workplace statistics in India reveal that over 80% of employees in the country are content with the hybrid/remote work model in 2023. By leveraging data analytics and learner profiles, content can be customized to match each learner's pace, learning style, and interests. This trend is not exclusive to the U.S.,
Workplace Diversity Statistics Nowadays, diversity and inclusion in the workforce is a natural necessity for most of us. But if you have individuals in your organization you still need to convince that Diversity in the workplace training has a high return on investment, show them some of the statistics below. .” — Jesse Jackson.
Researching Your Target Audience Statistics show that almost half, 48%, of online ads , don’t reach the right people, and billions of digital marketing dollars are wasted. Social Media Monitoring and Analytics It is not a question of competition regarding social media monitoring and analytics; the best way is to understand both.
You can use its Course Progress analytics tool to find out how many have unlocked and completed your training, or the App Usage tool to monitor how frequently the users are opening the applications. Highlights : Custom courses for onboarding and compliance training, content sharing, powerful analytics, learning management functionality.
Although statistics reveal that the education industry is responsible for 41% of the usage of virtual reality and simulations, simultaneously, the cost to customers is a significant adoption barrier. Statistics reveal that podcasting will become a $94.88 billion industry by 2028. to garner the listeners’ attention.
We organize all of the trending information in your field so you don't have to. Join 59,000+ users and stay up to date on the latest articles your peers are reading.
You know about us, now we want to get to know you!
Let's personalize your content
Let's get even more personalized
We recognize your account from another site in our network, please click 'Send Email' below to continue with verifying your account and setting a password.


Let's personalize your content