This site uses cookies to improve your experience. To help us insure we adhere to various privacy regulations, please select your country/region of residence. If you do not select a country, we will assume you are from the United States. Select your Cookie Settings or view our Privacy Policy and Terms of Use.
Cookie Settings
Cookies and similar technologies are used on this website for proper function of the website, for tracking performance analytics and for marketing purposes. We and some of our third-party providers may use cookie data for various purposes. Please review the cookie settings below and choose your preference.
Used for the proper function of the website
Used for monitoring website traffic and interactions
Cookie Settings
Cookies and similar technologies are used on this website for proper function of the website, for tracking performance analytics and for marketing purposes. We and some of our third-party providers may use cookie data for various purposes. Please review the cookie settings below and choose your preference.
Strictly Necessary: Used for the proper function of the website
Performance/Analytics: Used for monitoring website traffic and interactions
Evaluate the course by: Tracking learner progress Use LMS analytics to see completion rates and quiz scores. But the work doesnt stop there. Successful eLearning is an ongoing process. Collecting feedback Ask learners what worked and what didnt. Updating content Keep courses relevant by refreshing outdated information.
Why LMS Data Analytics Matters Learning Management Systems collect a wealth of information on learners—everything from course completion rates to assessment scores and engagement levels. Assessment ScoresScores from quizzes and exams provide insight into how well employees are retaining the training material.
Accessibility scores sound like a neat way to gauge how inclusive your website is, but let’s be real—they’re not the whole story. Years ago, we worked on a site that scored a shiny 95 on an automated checker. The score is not something to finish. Table of Contents: What Is an Accessibility Score and Why Does It Matter?
One reason for the focus on going above and beyond is that 80% of customer service companies use customer satisfaction (CSAT) scores as their main performance metric. But even with these huge and expensive efforts, 84% of consumers said their most recent engagement did not meet their expectations.
Develop an effective customer health scoring model to mitigate churn and identify opportunities across your customer base. Create highly targeted segments to drive more contextual and personalized engagements. Download the playbook today!
Use “no points” or “pass/fail” scoring to keep the focus on learning, not grading. How to do it in LearnDash: Turn on “Require Passing Score” for quizzes. Reduces test anxiety and boosts learner confidence. How to do it in LearnDash: Add a “Lesson Quiz” at the end of each lesson. Keep it short—3 to 5 questions is enough.
Available reporting includes lesson completion, video stats, quiz scores, and leaderboards. Posting quiz scores to a leaderboard so learners can see how they performed relative to their peers. Students who want to score at the top of the leaderboard will be encouraged to take more quizzes. ProPanel 3.0
Measurable training metrics may include completion rates, engagement rates, course evaluations, and assessment scores. Having measurable metrics is crucial to pinpoint what is and isn’t working in training development programs.
But when we looked beyond quiz scores and completion rates, we saw the truth: managers were having better conversations, resolving conflict faster, and building trust in real time. We once worked with a client who paused their leadership training because the data showed “no change.” The impact was there—it just wasn’t where they were looking.
of companies achieved a score indicating maturity in data management practices in the space.". In 2019, DiscoverOrg commissioned Forrester Consulting to evaluate sales and marketing intelligence practices in the B2B space. The primary takeaway? Forrester found “only 1.2% However, organizations are fighting back - and winning.
Application stories, confidence scores Alignment of behavior change with numbers Surveys, interviews, manager check-ins Report and Refine Summarize insights, identify trends, and adjust learning as needed. The idea is to define a few key indicators that truly matter, then monitor how they change after the intervention.
Average Global Innovation Index score 75.3 Average Global Innovation Index score 73.4 Average Global Innovation Index score 67.8 Average Global Innovation Index score 58.4 Average Global Innovation Index score 73.4 Average Global Innovation Index score 67.8 Average Global Innovation Index score 58.4
These include: Course completion rates Assessment scores Time spent on modules Knowledge retention over time The information gathered can be used to enhance outcomes and align learning goals with business targets on an ongoing basis.
Experts emphasize that scorecards translate features, costs, and credibility into quantifiable scores to simplify complex LMS options. Ease of Use Score: User interface and learner experience ratings. Scorecards facilitate data-driven choices by assigning scores or weights to each criterion, aligned with organizational priorities.
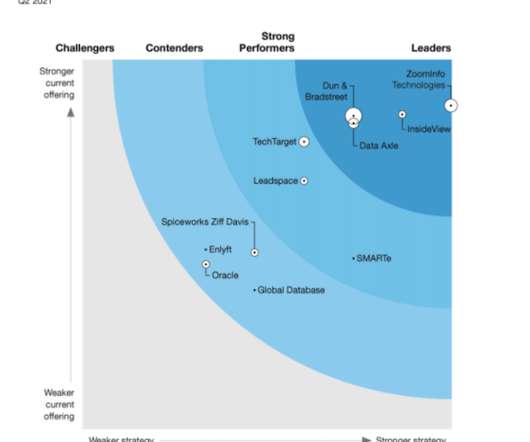
In our 24-criterion evaluation of B2B marketing data providers, we identified the 11 most significant vendors — Data Axle, Dun & Bradstreet, Enlyft, Global Database, InsideView, Leadspace, Oracle, SMARTe, Spiceworks Ziff Davis, TechTarget, and ZoomInfo Technologies — and researched, analyzed, and scored them.
Fairness & Standardization : AI-driven rubrics help reduce grading bias by applying uniform scoring metrics, ensuring that different submission formats are evaluated equitably. This approach ensures greater consistency in scoring, minimizing bias in pronunciation assessment. Algorithmic Bias Who Does AI Benefit?
Track key metrics like enrollment trends, course completion rates, and learner satisfaction scores. Prove ROI and Make Data-Backed Business Decisions Whether selling courses or training employees, LMS analytics help you prove value. Use these learning data insights to refine your offerings, justify pricing, or secure stakeholder buy-in.
Another company used an active-learning approach, integrating movement-based tasks into the content itself, which resulted in significantly higher post-training test scores compared with traditional online training. This approach not only improved employee engagement but also increased retention of the material.
Learn why looking beyond completion rates and quiz scores is essential to truly measure impact and drive real behavioral change in your organization. This post was first published on eLearning Industry.
Knowing what you need from an eLearning authoring tool can be hard, especially when there are so many options on the market. gomo’s new ebook aims to save you time and hassle by identifying 12 must-have authoring tool features.
Use scoring matrices for objective comparison. Stakeholder Engagement and Scoring Involving HR, IT, and end-users enhances buy-in. Receiving and Analyzing Proposals After deadline, evaluate submissions against your predefined criteria such as core functionalities, user experience, scalability, reputation, support, and pricing.
Gamification: Make Learning Fun One can include game elements like scoring points, leaderboards, badges, challenges, and more, which would increase the engagement of the individuals. Gamification acts on the rewards system of the brain, so learning becomes enjoyable and rewarding for the mind.
Engagement Metrics: Metrics such as course completion rates, assessment scores, and participation levels can provide insights into learner engagement. Customizable reporting that breaks down scores by specific topics or skills can highlight areas for improvement.
Measure and Improve Track Performance: Use LMS analytics to track completion rates, assessment scores, and engagement levels. Encourage Feedback: Solicit feedback from employees to improve training programs continuously. Evaluate Effectiveness: Assess the impact of training on compliance and behavior change.
And so if I didn’t, if I didn’t know your scores or whatever, I’d be like I know visionary and learner. I know that because I’ve interacted with Chris and you can’t help communicate your visionariness and your learner ness.
Metrics to Measure Performance : Evaluate learning outcomes with reports on quiz scores, attendance, and time spent. Primarily used for structured training, an LMS supports functions like: Learning Analytics : Gain insights into learner engagement, performance, and completion rates.
This allows for data exchange, such as tracking user progress or recording assessment scores. SetValue() sets values for elements within a SCORM-compliant course, like setting assessment scores or updating learner profiles with new information about their preferences or skillset levels.
Platforms could take in inputs from attendance, scores, and engagement levels to intervene in their learning paths. It uses NLP to offer real-time feedback and speed up scoring. AI predictive analysis has turned this mere possibility into a reality! Student data is a storehouse of information.
Features : Offers built-in scoring rubrics, advanced analytics, and real-time feedback. ETU Simulation Builder An AI-powered tool specializing in immersive simulations with adaptive learning paths. The platform is designed to enhance decision-making skills through scenario-based assessments.
Capability Detail Consultative Discovery Workshops to define business impact targets Learning Engineering Performance-based frameworks, not just information delivery Rapid Prototyping Sample modules created in 2–4 weeks for executive feedback Multimedia Excellence Video, animation, AR, voiceover with in-house creative teams Agile Development Iterative (..)
Instead of saying: 95% of employees completed cybersecurity training, and 87% scored above 80%. Step 5: Communicate results to stakeholders Collecting data is not enough, L&D must communicate its impact in language that matters to business stakeholders.
Engagement Scores: Feedback on onboarding satisfaction and engagement. Knowledge Retention: Post-training assessment scores. Many organizations leverage Paradiso LMS to automate onboarding across multiple locations or ensure mandatory compliance training, resulting in faster onboarding and higher engagement scores.
Key metrics include course completion rates, time spent, and quiz scores. Set KPIs such as course completion, engagement, and satisfaction scores to track progress. Powerful Analytics Tools Data insights help optimize training programs. Advanced analytics track learner progress, assess understanding, and identify improvement areas.
Coursera has “a strong [content] partner ecosystem” , according to Forrester’s report, and Coursera received the maximum score of 5/5 in the Partner Ecosystem criterion. Coursera received the highest score possible in the AI Capabilities for Skills Acquisition criterion.
Tracking and Reporting Progress monitoring: Progress monitoring in real-time with dashboards to track student progress, completed courses, and scores. Version Control: The possibility to edit content while retaining earlier versions. Reports: Are you able to create reports according to your requirements- by users, group, course or date?
Use both numbers (like scores, attendance, and retention) and personal stories (like interviews or open-ended survey responses). Level 4: Bigger Impact Is the training helping your organization or community in a meaningful way? Look for changes like more member involvement, better community outcomes, or new policies.
Key Metrics Engagement rate Content interaction levels Completion and progress rates Knowledge retention scores from assessments Net Promoter Score (NPS) Community activity and member growth Integrating these metrics enables organizations to refine strategies continually, ensuring social learning initiatives produce tangible results.
Dependable for tracking: From lesson location and completion status to score raw and time spent, SCORM helps you track learners’ progress in detail. It supports basic tracking (lesson status, score raw, time spent) and has broad compatibility across LMS platforms. Skipping completion status and score tracking configurations.
Knowledge Retention Scores – Assess understanding through periodic testing. Success can be tracked through training completion rates, knowledge retention scores, employee feedback, time-to-competency, and cost savings. Employee Feedback and Satisfaction – Gather insights on course effectiveness.
Bersin’s Four Key Efficiencies of Micro-Learning include compactness compared to conventional pedagogy; regularity/discrete nature of topic design; interactive activities at strategic locations throughout units maintain engagement; students allowed reattempt quizzes improving scores.
Leaderboards and scoring systems help trainers and learners track performance, identify areas for improvement, and set clear learning goals. Gamified training modules use simulations, quizzes, and storytelling techniques to reinforce learning, ensuring better retention and application of skills.
The Role of Data Analytics in Education and Training Analytics involve collecting and interpreting large volumes of learner data—like completion rates, assessment scores, and activity times—to identify patterns and inform instructional strategies. Assessment Scores: Measure understanding and highlight gaps.
We organize all of the trending information in your field so you don't have to. Join 59,000+ users and stay up to date on the latest articles your peers are reading.
You know about us, now we want to get to know you!
Let's personalize your content
Let's get even more personalized
We recognize your account from another site in our network, please click 'Send Email' below to continue with verifying your account and setting a password.


Let's personalize your content