This site uses cookies to improve your experience. To help us insure we adhere to various privacy regulations, please select your country/region of residence. If you do not select a country, we will assume you are from the United States. Select your Cookie Settings or view our Privacy Policy and Terms of Use.
Cookie Settings
Cookies and similar technologies are used on this website for proper function of the website, for tracking performance analytics and for marketing purposes. We and some of our third-party providers may use cookie data for various purposes. Please review the cookie settings below and choose your preference.
Used for the proper function of the website
Used for monitoring website traffic and interactions
Cookie Settings
Cookies and similar technologies are used on this website for proper function of the website, for tracking performance analytics and for marketing purposes. We and some of our third-party providers may use cookie data for various purposes. Please review the cookie settings below and choose your preference.
Strictly Necessary: Used for the proper function of the website
Performance/Analytics: Used for monitoring website traffic and interactions
More time spent by the instructor and lower ratios = higher prices. These tiers work well for me: Premium: ~4 hrs of my time per week: £500-£1k per seat, cohort-instructor ratio of 1:20. Mid: ~1-3 hrs of my time per per week: £250-£500 per seat, cohort-instructor ratio of 1:50. Diverse stock photos.
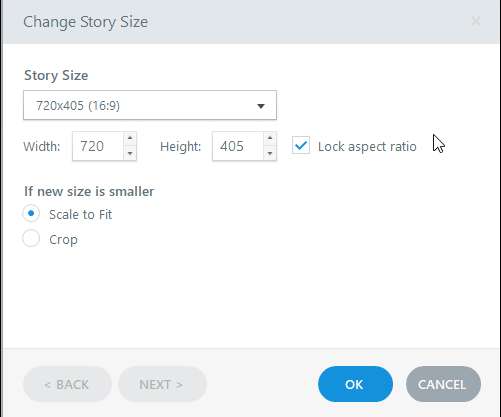
For that reason, I think the eLearning canvas should be set up to use a 16:9 aspect ratio as opposed to 4:3. The aspect ratio of an eLearning canvas designed to be viewed on its side, or in landscape mode, is the ratio of its longer side to its shorter side. Both 1024x576 and 1280x720 are 16:9 ratios.
At the 184:1 ratio for that level of learning, that’s about a $100/hour rate, but that includes everyone on the team (IDs, project managers, SMEs, developers, etc.). Bryan Chapman includes some cost estimates with his benchmarks for how long it takes to create learning. Image Credit: Money 2 by Daniel Borman.
So, I’d roughly (and generously) estimate that the ratio is around 80:20 for content: practice. The point is that I think our ratio should really be 50:50 if not 20:80 for content:practice. What ratios do you see? And what ratios do you think makes sense? Which many orgs aren’t doing yet.
Key Metrics that Matter 🔑 Discover essential financial ratios and indicators that tell the real story of your business. Key Takeaways: Read Between the Lines 📊 Learn how to interpret your financial statements beyond the basics to uncover hidden insights.
This project is on the low end of a Level 2 by Chapman’s study, so the ratio for development is 127:1 (that is, 1 hour of e-learning takes 127 hours to develop). This estimate says that Captivate and Storyline development generally take 2 hours per finished minute to produce, or a ratio of 120:1.
This is where the concept of ‘development ratio’ becomes important. What is a Development Ratio? A development ratio is a measure that reflects the amount of time required to develop an eLearning course. The development ratio is influenced by the complexity and interactivity of the eLearning course.
The article and research are from 2004, and I expect these ratios have gone down in the last 10 years. The estimates here say it’s a 10:1 ratio for faculty time and about $25K per credit hour. — Campus Technology. Time and cost estimates for online higher ed. tags: highered instructionaldesign e-learning.
This estimate says that Captivate and Storyline development generally take 2 hours per finished minute to produce, or a ratio of 120:1. This project a Level 2 by Chapman’s study, so the ratio for development is 184:1 (that is, 1 hour of e-learning takes 184 hours to develop).
One can evaluate the cost to benefit ratio of a solution by measuring the results in terms of the time or effort saved. For an eLearning project to be executed successfully, it is not required for the team to have all the tools in their box.
The argument in favor of listing learning objectives I don’t want to directly pile on this person any further (I already ratioed him with my comment on his article), but someone recently shared some elearning tips on LinkedIn. Is that really the best way to communicate with learners about the goals of training?
Learn common aspect ratios, how to choose the one that’s right for you, and tailor your aspect ratio to get professional results. The post How to use Aspect Ratio for Videos appeared first on The TechSmith Blog. No more black bars!
As a result, the overall “footprint,” or ratio of training staff relative to the learner population continued to decline in many companies. . “ The L&D footprint continues to shrink. Although many training teams added staff during the year, these additions were outpaced by faster growth in learning populations.
70:20:10 is Not About the Numbers The 70:20:10 model is not about percentages or numbers and there is no universal ‘right’ ratio. So the ratios describing how people learn in a large compliance-driven organisation are likely to be different from an agile start-up. " Jay wrote the seminal book on Informal Learning.
This 70:20:10 breakdown has since been supported by subsequent research , though sometimes the ratio is represented as 80:20 to reflect informal learning and formal training respectively. • 10% of learning occurs via formal training (eg classes). • 20% on informal learning.
I am not particularly stuck on the exact ratios (and there is huge debate on that here and here ) but agree that Informal is a big chunk of all learning – which should not be left to chance.
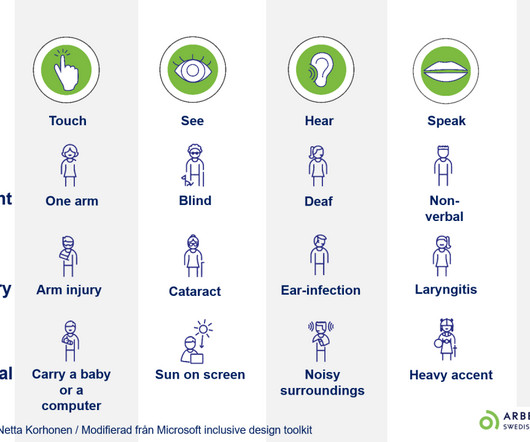
Increasing the contrast between the text and the background could give you something like this: According to WCAG, for text, a contrast ratio of at least 4.5:1 1 is required , except for: Text that is at least 18pt or at least 14pt and bold (a minimum ratio of 3:1). You can find the non-text WCAG contrast guidance here. 1 requirement.
Remember, the framework is a guide for balancing your learning strategy by learning avenues and is not a firm a rigid ratio that must be applied or else. Included in the infographic is some advice for applying the 70:20:10 Framework.
Remember, the framework is a guide for balancing your learning strategy by learning avenues and is not a firm a rigid ratio that must be applied or else. Included in the infographic is some advice for applying the 70:20:10 Framework.
Ensure Lock aspect ratio is deselected. (The Format Shape dialog box will open with the Size category selected. Notice the Height and Width fields are pre-populated with the current size of the shape inches.) The Height will automatically be converted to 6.25
By default, Storyline sets its slides to a 4:3 aspect ratio. If you’re importing PowerPoint slides that are set at a 16:9 aspect ratio (or something else), you may end up with some objects becoming distorted or placed off your slide.
In this article, we'll take a look at the labour to revenue ratio, what it can tell you about your business, how to calculate it, and the best practices to optimise it for your business. What is labour to revenue ratio? Do you need to measure labour to revenue ratio? Yes, but not how you think.
In this article, we'll take a look at the labour to revenue ratio, what it can tell you about your business, how to calculate it, and the best practices to optimise it for your business. What is labour to revenue ratio? Do you need to measure labour to revenue ratio? Yes, but not how you think.
To calculate ROI, the benefit (return) of an investment is divided by the cost of the investment; the result is expressed as a percentage or ratio. ROI is a performance measure used to evaluate the efficiency of an investment or to compare the efficiency of a number of different investments.
level AA requires a contrast ratio of at least 4.5:1 Overuse of color can cause cognitive overload and distractions. Contrast Appropriate contrast is key so that readers can distinguish text within the background. 1 for normal text and 3:1 for large text. Contrast cannot always be discerned with the naked eye.
Based on the golden ratio , the golden spiral can be found in some of the most famous artworks in the world. Famed polymath Leonardo da Vinci incorporated the mathematics of this ratio into his paintings. On widescreen slides – as in, slides with a 16:9 ratio – a 12-column grid works best. We feel pleasure and we call it beauty.”
To start, 70:20:10 is a framework, it’s not a specific ratio but a guide to thinking about the whole picture of developing organizational solutions to performance problems. Now, there are times when the ratio changes. I joined Will as a moderator, but he did the heavy lifting of organizing the event and queueing up questions.
When scaling your image, it’s crucial to maintain the ratio of width to height, known as aspect ratio, so it doesn’t end up stretched or warped. Prevent an image from appearing stretched by locking the aspect ratio when changing the width or height. What is an aspect ratio? What are the best file formats for images?
Of course, these ratios assume a participating population; they don’t account for the proportion of the membership that is disengaged with the community. That is to say, not even lurking. And that proportion may be surprisingly large.
Instagram posts can be square (1:1 ratio), portrait (4:5 ratio), or landscape (1.9:1 To do this, go to the Design tab, navigate to Slide Size and select Custom Slide Size from the drop-down menu. Here you can choose from pre-set slide sizes or set your own.
These values represent the ratio of the line spacing to the size of the type. From the Line Spacing drop-down menu in the Paragraph dialog box, selecting Multiple gives you the option to enter your specific line spacing ratio instead of just using a preset. increments from 1.0
While ideally, we’d have a ratio closer to 80/20 for practice versus content, in many cases the budget expectations are for that ratio to be reversed. Note that the practices should be engaging as well, and we should be testing and tuning them as well as the overall experience.
Besides, the student-trainer ratio is also an important factor that impacts training quality. The training partner should provide adequate resources for the training. Hence, they should be available for assistance as and when needed, preferably during office hours.
Aim for a 40% original and 60% curated content ratio, emphasizing high-quality and actionable resources. Diversify Your Content Mix Maintain a balanced approach by integrating various types of content, ensuring a mix that resonates with different learning styles and preferences.
Social learning approaches have a 75:1 ROI ratio compared to formal web-based training. The same research concludes that social learning approaches deliver a 75:1 ROI ratio compared to web-based formal training to unlock and spread knowledge across an organization. Need proof? Enterprises and social learning.
Although the 70:20:10 ratio isn’t fixed , supporting a blended learning strategy with modern learning technology means your elearning content should strike a healthy blend between on the job training, developing through others and structured coursework. Boost UX with modern learning.
While the exact ratio of the approach that offers the most effective training is debatable, a good index to map the various options is through the 70:20:10 model for Learning and Development. The biggest learning certainly is on the job (often through challenges that we face and overcome).
You need to be aware of the contrast ratio between text and the background throughout your presentation. According to the Web Content Accessibility Guidelines (WCAG), for text a contrast ratio of at least 4.5:1 1 is required except for: Text that is at least 18pt or at least 14pt andbold (a minimum ratio of 3:1).
So the trick is managing the ratio of create and curate for your L&D content strategies. 7: Measuring the impact of learning Using business and learning goals as a foundation, establish both quantitative and qualitative ways to capture: Did the audience actually consume the content?
Combined with efficiency ratios like hours of learning consumed per worker, the cost of learning per hour, staff-to-worker ratios, and your modality mix, these metrics can begin to tell a basic story of how your workforce interacts with your learning initiatives, but they don’t confirm that anyone actually learned anything.
Presenting content and drilling knowledge (particularly in about an 80/20 ratio), is essentially a waste of time. Connect their actions to the model! What this also implies is that learning is much more practice than content presentation. Meaningful practice should be more than half the time.
However, the way these three broad categories are described in the model can lead to a focus on the ratios rather than the underlying principles and categorisation. It also points to some broad – rather than specific - ratios. We can expect to see more research output and new individual ratios in the next few years.
You could have a text-heavy slide about counting macros, with bullets and lots of text talking about ratios and calculations for carbs versus protein versus fat. We’re about to show you a few templates from our Template Library that will help you squeeze all that info onto one slide, and keep it visually appealing.
What's your take on the training to break ratio for live training? Or perhaps you've got some other ratios in mind that you'd like to share? Do you think 90 minutes is best? Is 75 minutes better? Feel free to comment below.
We organize all of the trending information in your field so you don't have to. Join 59,000+ users and stay up to date on the latest articles your peers are reading.
You know about us, now we want to get to know you!
Let's personalize your content
Let's get even more personalized
We recognize your account from another site in our network, please click 'Send Email' below to continue with verifying your account and setting a password.


Let's personalize your content